
Between July 5–July 19, the Express Entry pool declined by over 3,500 profiles, and nearly every score band from 421 onward shrank in size, according to the latest data published by Canada’s immigration department.
The number of top-scoring profiles fell from 19,136 to 18,644 over this two-week period.
See how competitive your Express Entry profile is
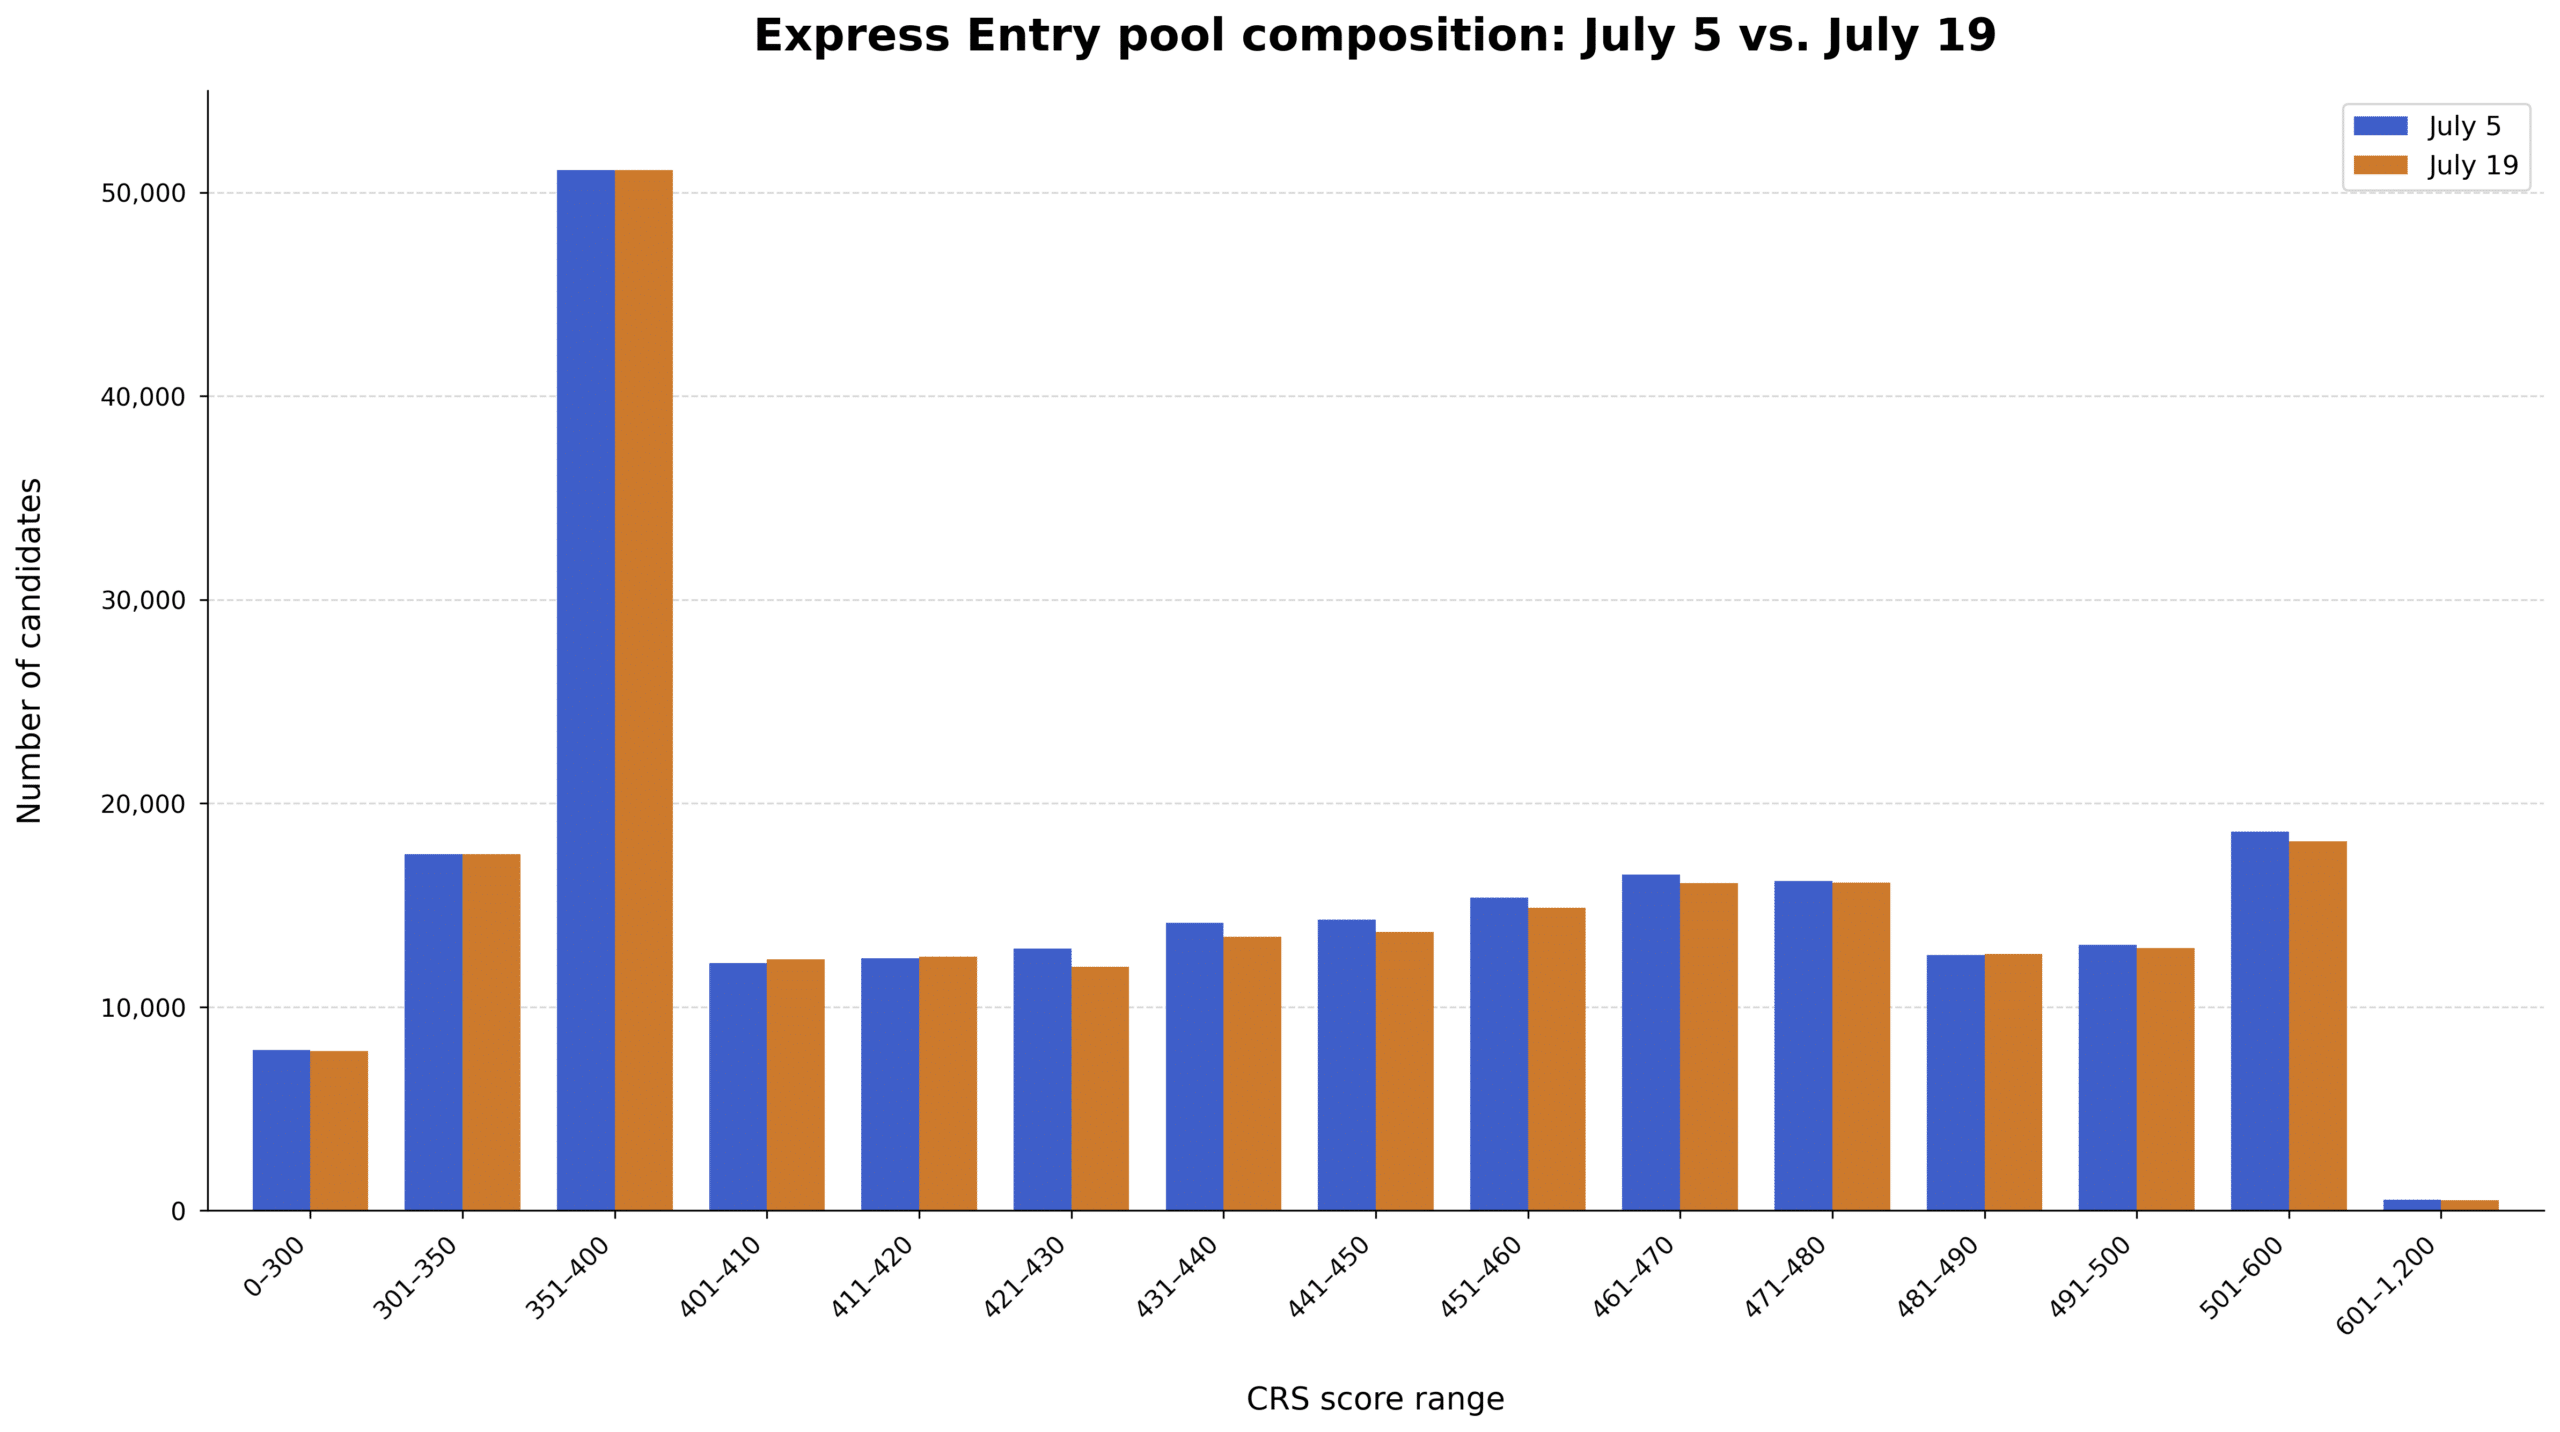
The following table compares the composition of the Express Entry pool as of July 19 with the distribution as of July 5 (the previous update):
| CRS score range | July 5 | July 19 | Difference |
|---|---|---|---|
| 0–300 | 7,873 | 7,836 | -37 |
| 301–350 | 17,513 | 17,490 | -23 |
| 351–400 | 51,096 | 51,107 | +11 |
| 401–410 | 12,144 | 12,339 | +195 |
| 411–420 | 12,383 | 12,460 | +77 |
| 421–430 | 12,870 | 11,961 | -909 |
| 431–440 | 14,127 | 13,437 | -690 |
| 441–450 | 14,294 | 13,680 | -614 |
| 451–460 | 15,378 | 14,879 | -499 |
| 461–470 | 16,499 | 16,086 | -413 |
| 471–480 | 16,198 | 16,119 | -79 |
| 481–490 | 12,555 | 12,615 | +60 |
| 491–500 | 13,061 | 12,880 | -181 |
| 501–600 | 18,611 | 18,133 | -478 |
| 601–1,200 | 525 | 511 | -14 |
| Total | 235,127 | 231,533 | -3,594 |
These data are also presented in the graph below:
How competitive is the Express Entry pool as of the latest data?
The table below provides insight into Express Entry pool competitiveness by showing the proportion of candidates in each Comprehensive Ranking System (CRS) score range alongside the percentile ranges associated with the upper and lower limits of that range.
The figures are calculated using Express Entry pool data from July 19.
| CRS score range | Number of candidates | Cumulative | Percentile range | Percentage |
|---|---|---|---|---|
| 0–300 | 7,836 | 7,836 | 0.00%–3.38% | 3.38% |
| 301–350 | 17,490 | 25,326 | 3.38%–10.94% | 7.55% |
| 351–400 | 51,107 | 76,433 | 10.94%–33.01% | 22.07% |
| 401–410 | 12,339 | 88,772 | 33.01%–38.34% | 5.33% |
| 411–420 | 12,460 | 101,232 | 38.34%–43.72% | 5.38% |
| 421–430 | 11,961 | 113,193 | 43.72%–48.89% | 5.17% |
| 431–440 | 13,437 | 126,630 | 48.89%–54.69% | 5.80% |
| 441–450 | 13,680 | 140,310 | 54.69%–60.60% | 5.91% |
| 451–460 | 14,879 | 155,189 | 60.60%–67.03% | 6.43% |
| 461–470 | 16,086 | 171,275 | 67.03%–73.97% | 6.95% |
| 471–480 | 16,119 | 187,394 | 73.97%–80.94% | 6.96% |
| 481–490 | 12,615 | 200,009 | 80.94%–86.38% | 5.45% |
| 491–500 | 12,880 | 212,889 | 86.38%–91.95% | 5.56% |
| 501–600 | 18,133 | 231,022 | 91.95%–99.78% | 7.83% |
| 601–1,200 | 511 | 231,533 | 99.78%–100.00% | 0.22% |
The percentiles represent the proportion of candidates in the pool who have CRS scores equal to or below the upper threshold of each score band.
For clarity, the percentiles are displayed as ranges, since candidates within a CRS score range may fall between the two listed values.
Which draws have not been accounted for in the July 19 distribution?
The July 19 distribution does not consider the two draws conducted by Immigration, Refugees and Citizenship Canada (IRCC) on July 20 and 21, through which a combined total of 2,511 invitations to apply were issued:
| Date of draw | Round type | Invitations issued | CRS score of lowest-ranked candidate |
|---|---|---|---|
| July 20 | Provincial Nominee Program | 511 | 744 |
| July 21 | Canadian Experience Class | 2,000 | 516 |
What accounted for the changes in Express Entry profiles between July 5 and July 19?
Canada’s immigration department held four selection rounds in the two-week period between July 5 and July 19, through which a total of 8,034 invitations were issued:
| Date of draw | Round type | Invitations issued | CRS score of lowest-ranked candidate invited |
|---|---|---|---|
| July 6 | Provincial Nominee Program | 534 | 708 |
| July 7 | Canadian Experience Class | 2,000 | 517 |
| July 9 | French-Language proficiency | 5,000 | 420 |
| July 10 | Senior managers with Canadian Work Experience | 500 | 392 |
The total number of profiles in the Express Entry pool fell by 3,594 during this period.
Getting permanent residence through the Express Entry system
Express Entry is the federal government’s principal application management system for economic immigration candidates seeking permanent residence (PR) and intending to settle outside Quebec.
To enter the Express Entry pool, candidates must first satisfy the eligibility requirements of at least one program administered through the system:
Eligible profiles are assigned a CRS score based on factors such as age, education, official-language proficiency, and work experience.
IRCC periodically conducts invitation rounds and invites top-scoring candidates to apply for PR.
The department also uses category-based selection to invite candidates with specific attributes that support identified economic priorities, which typically features draws with much lower cutoff scores than other draw types.
There are currently 10 Express Entry categories, including French-language proficiency and occupation-based categories such as healthcare and social services, trades, STEM, education, and transport.
To put this into perspective, in 2026, CEC cut-offs have ranged from 507–518 in 2026, compared with 462–476 for healthcare and social services draws.
Those who are selected from the Express Entry pool have up to 60 days to respond with an application for PR.
PR applications submitted through Express Entry have historically been processed in about six months.
In contrast, PR applications submitted through the base PNP have ranged from 12–20 months over the past year.